

Introduction
In today's fast-changing tech world, I find it really important to carefully set up and look after applications to make sure they work well, stay safe, and can handle more stuff if needed. This project went through different steps for me to make, protect, automate, keep an eye on, notify about, and start using a Netflix Clone app using Amazon Web Services (AWS) and Kubernetes. I wanted not just to put the app out there but also to make it super safe, automate tasks, watch how well it works, and manage it smoothly in a special kind of setup. Let's take a closer look at each step to understand how I made this project successful.
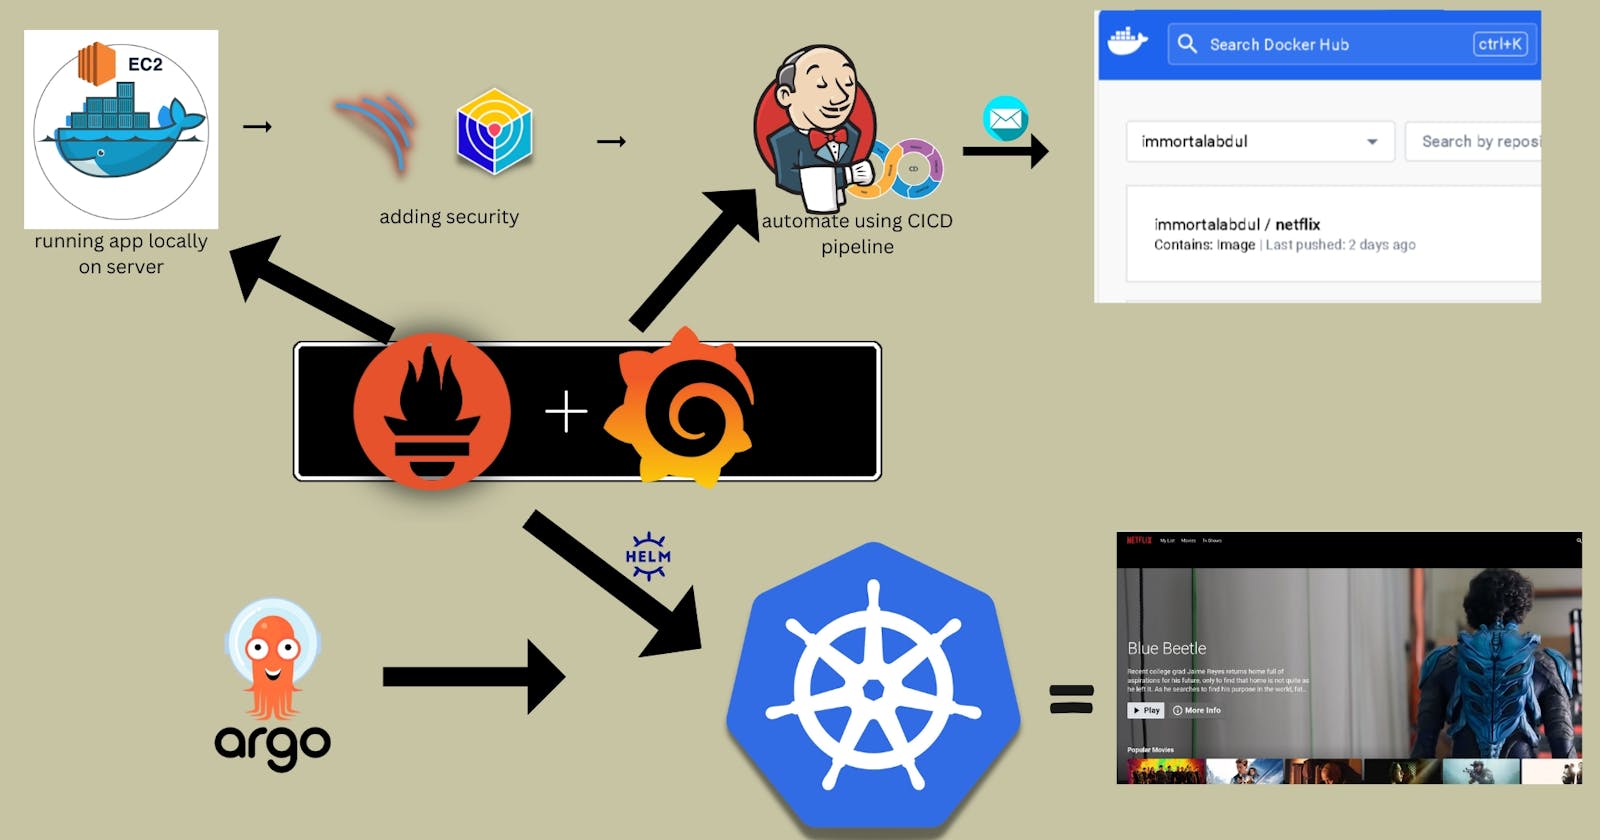
Architecture of the project
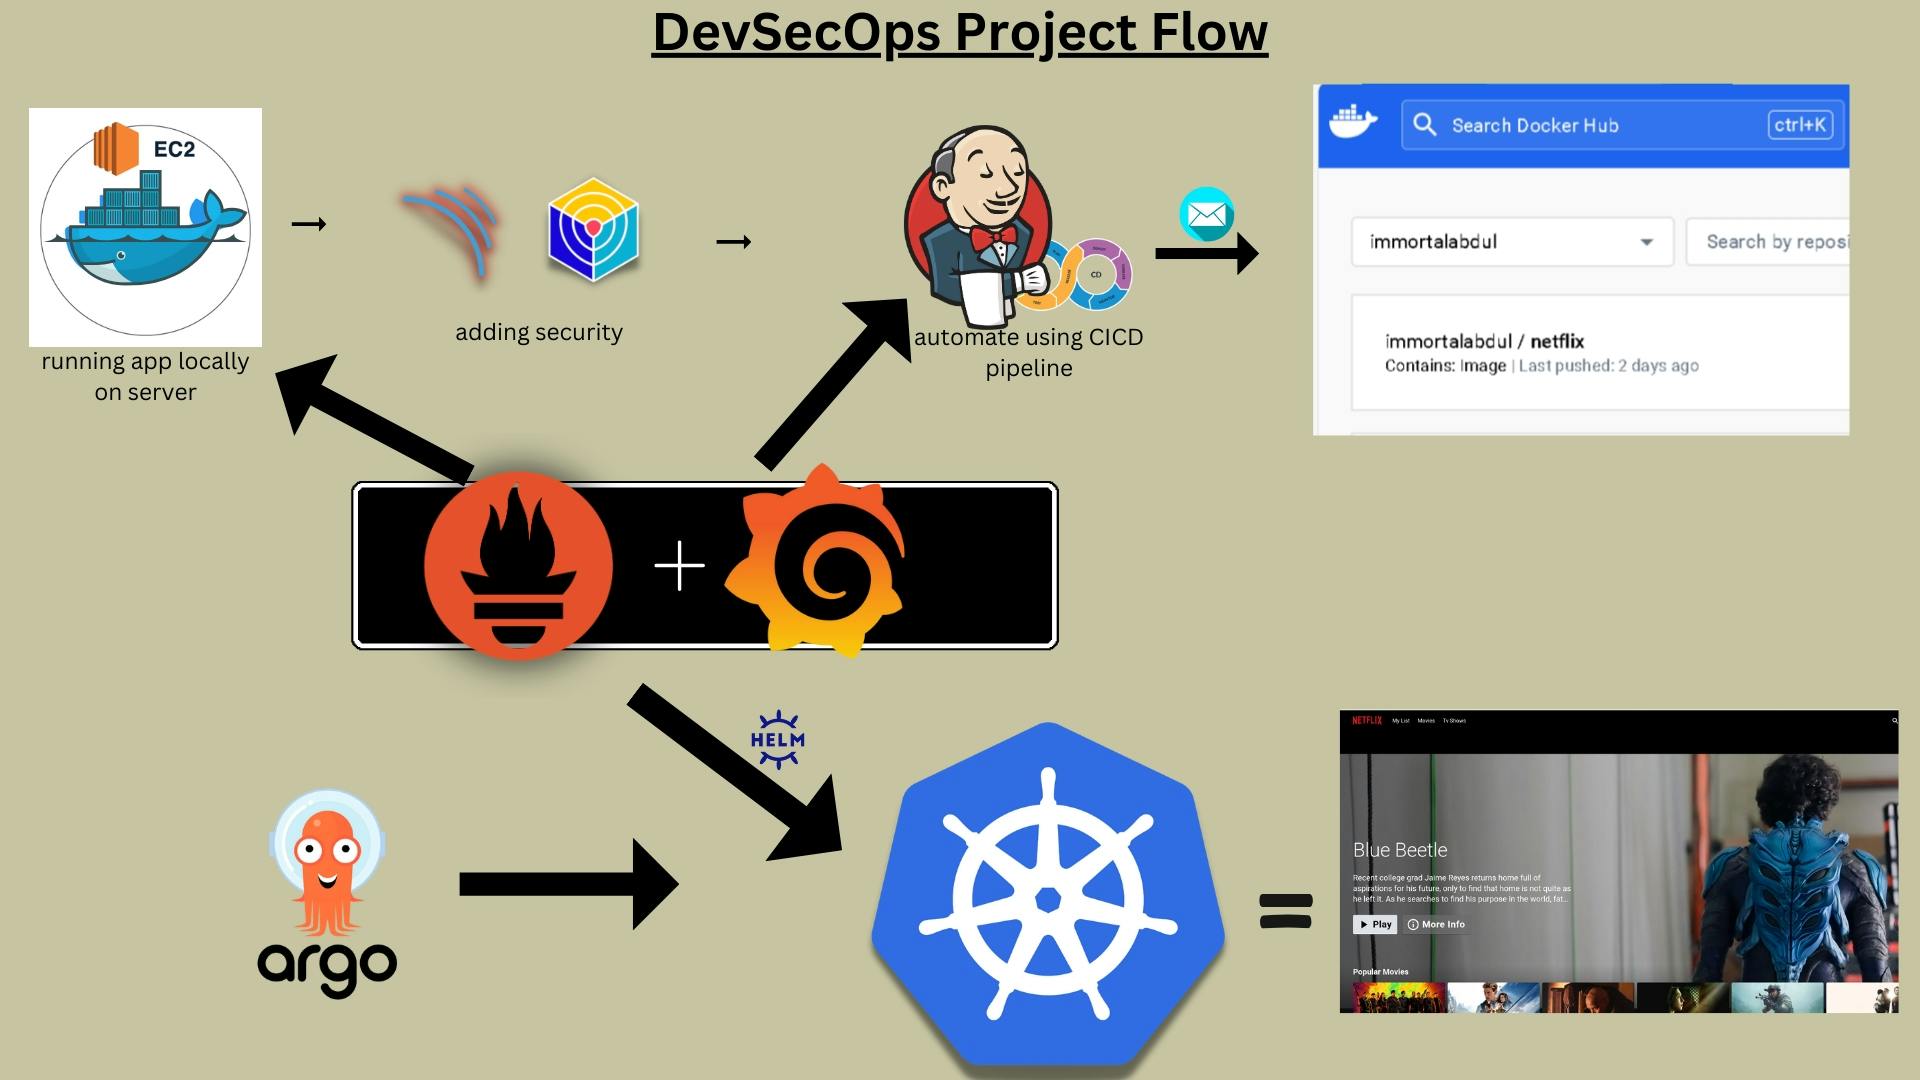
Phase 1: Initial Setup and Deployment
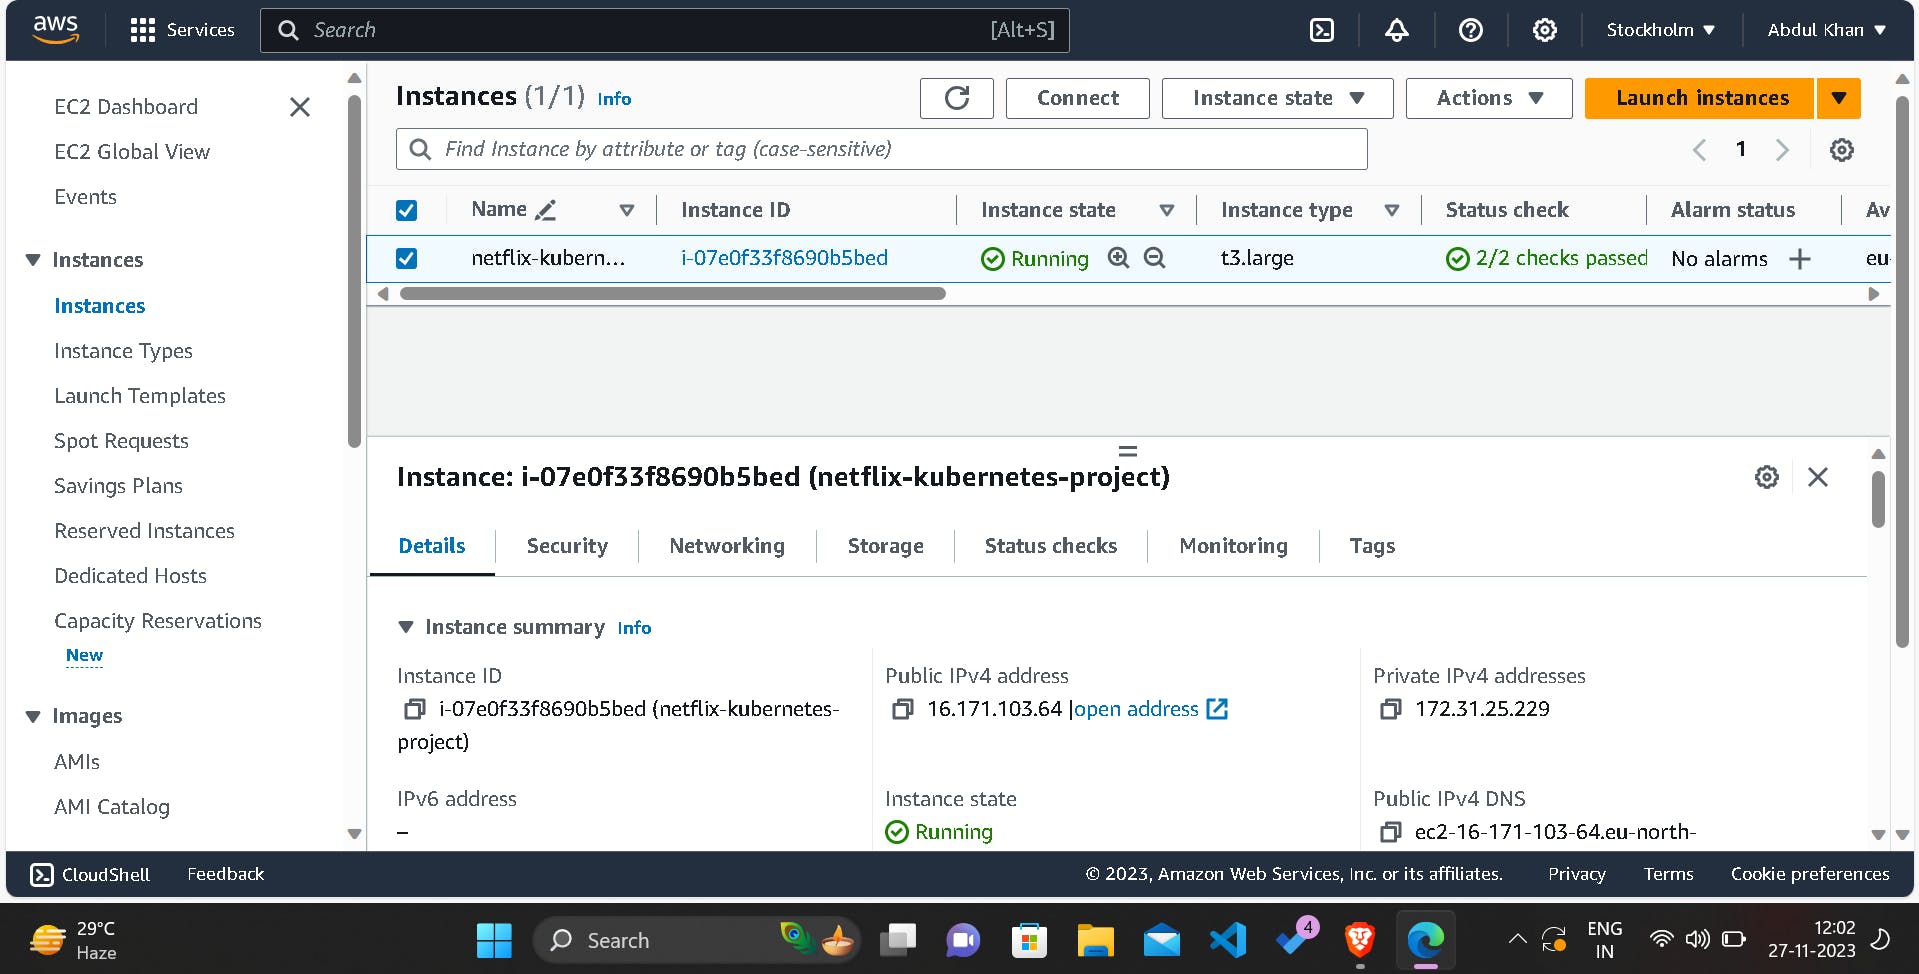
Step 1: Launch EC2 Instance on AWS
To start the project, I set up a computer on Amazon Web Services (AWS), choosing Ubuntu 22.04 as the operating system. After the computer was ready, I connected to it using a tool called SSH.
ssh -i <your-key.pem> ubuntu@<instance-ip>
Step 2: Clone the Code
After ensuring that all packages were up to date, I cloned the Netflix Clone code repository onto the EC2 instance.
sudo apt-get update
https://github.com/immortalAbdul01/DevSecOps-Project.git
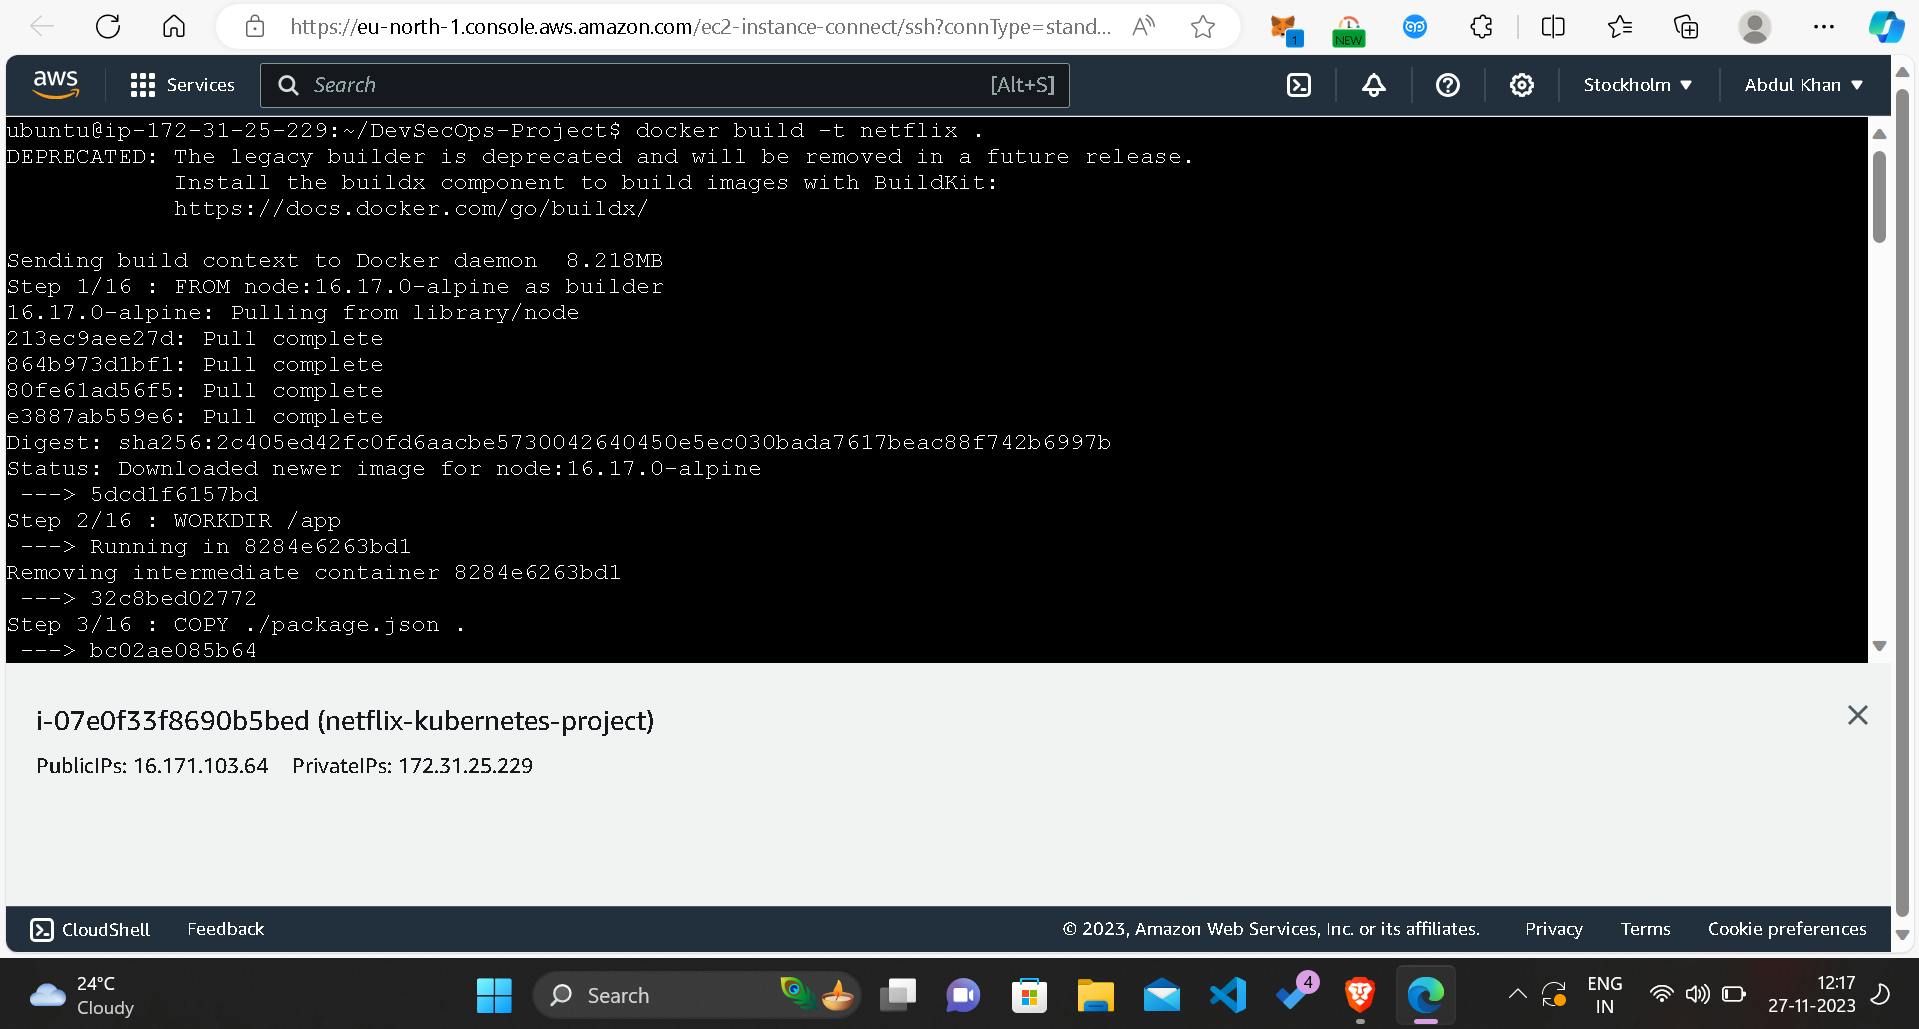
Step 3: Install Docker and Run the App Using a Container
Next, I installed Docker on the EC2 instance and built and ran the application using Docker containers.
sudo apt-get install docker.io -y
sudo usermod -aG docker $USER
newgrp docker
sudo chmod 777 /var/run/docker.sock
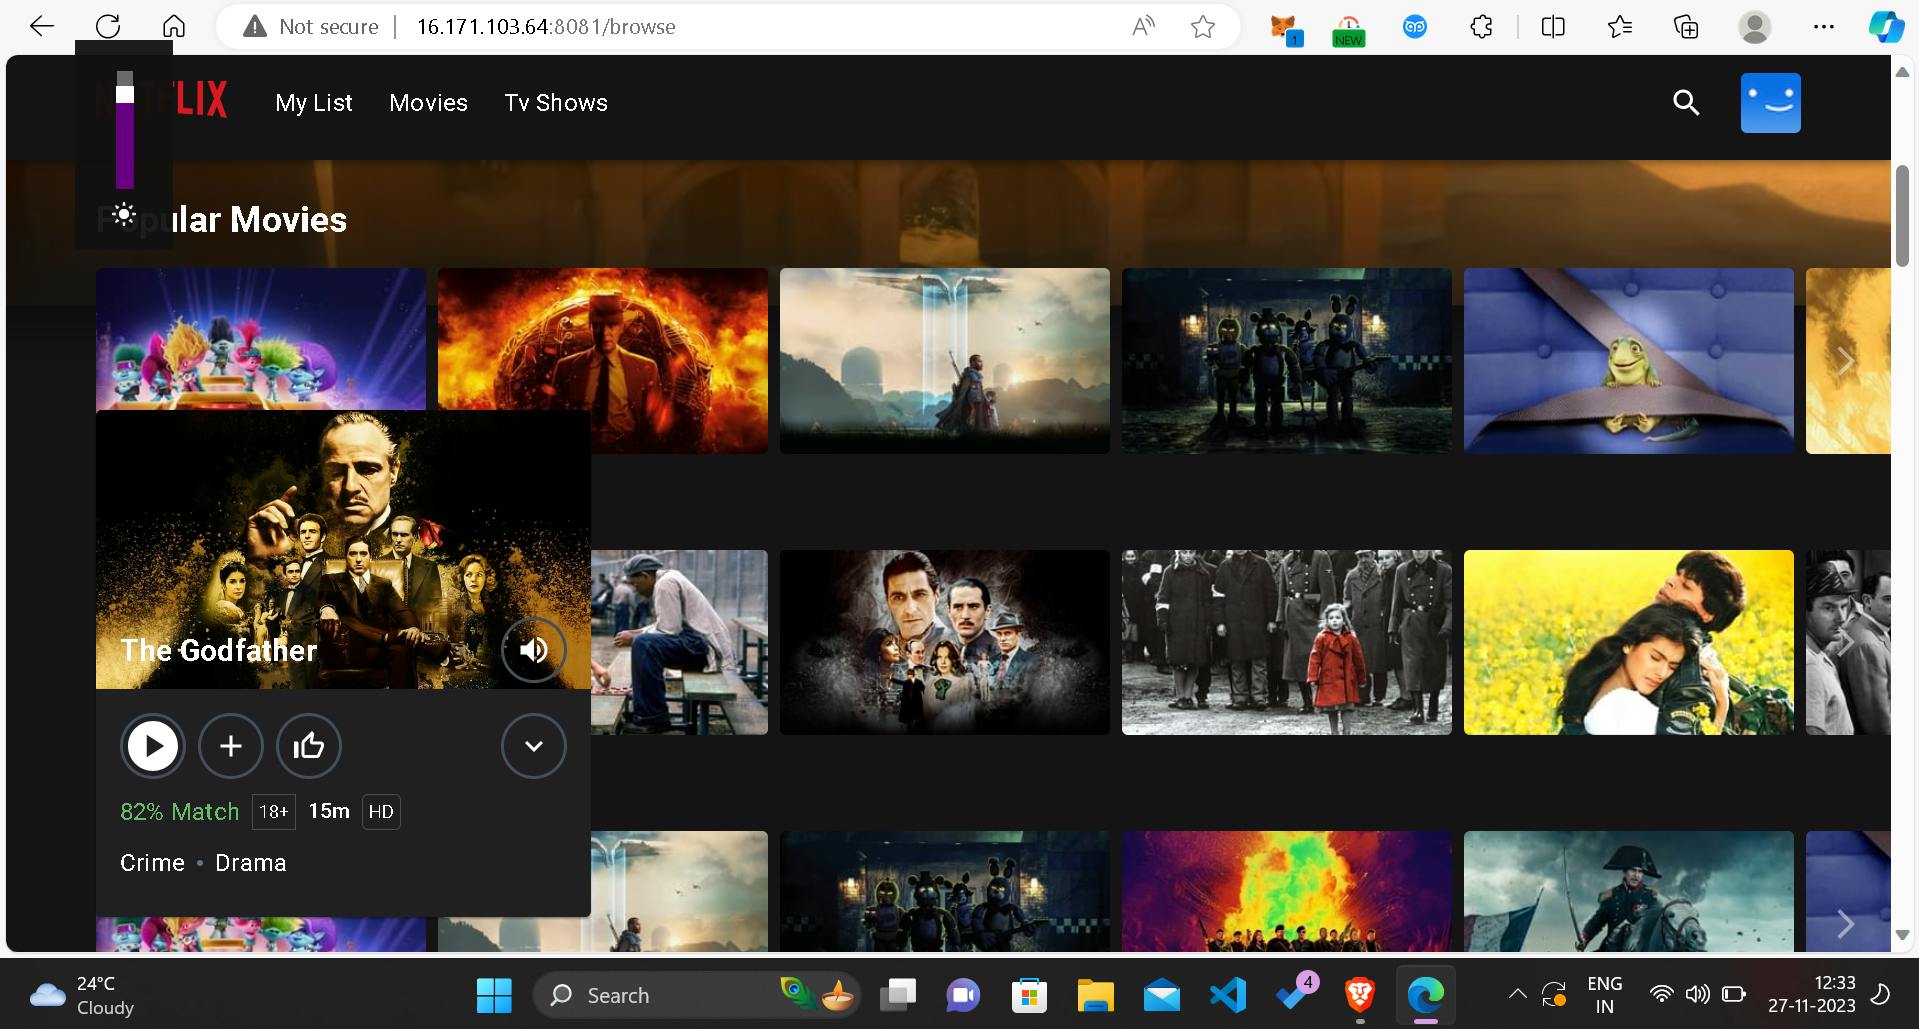
docker build -t netflix .
docker run -d --name netflix -p 8081:80 netflix:latest
Step 4: Get the API Key
To access additional features, I obtained the TMDB API key by registering on The Movie Database website and then updated the Docker image with the acquired API key.
docker build --build-arg TMDB_V3_API_KEY=<your-api-key> -t netflix .
Phase 2: Security
Install SonarQube and Trivy
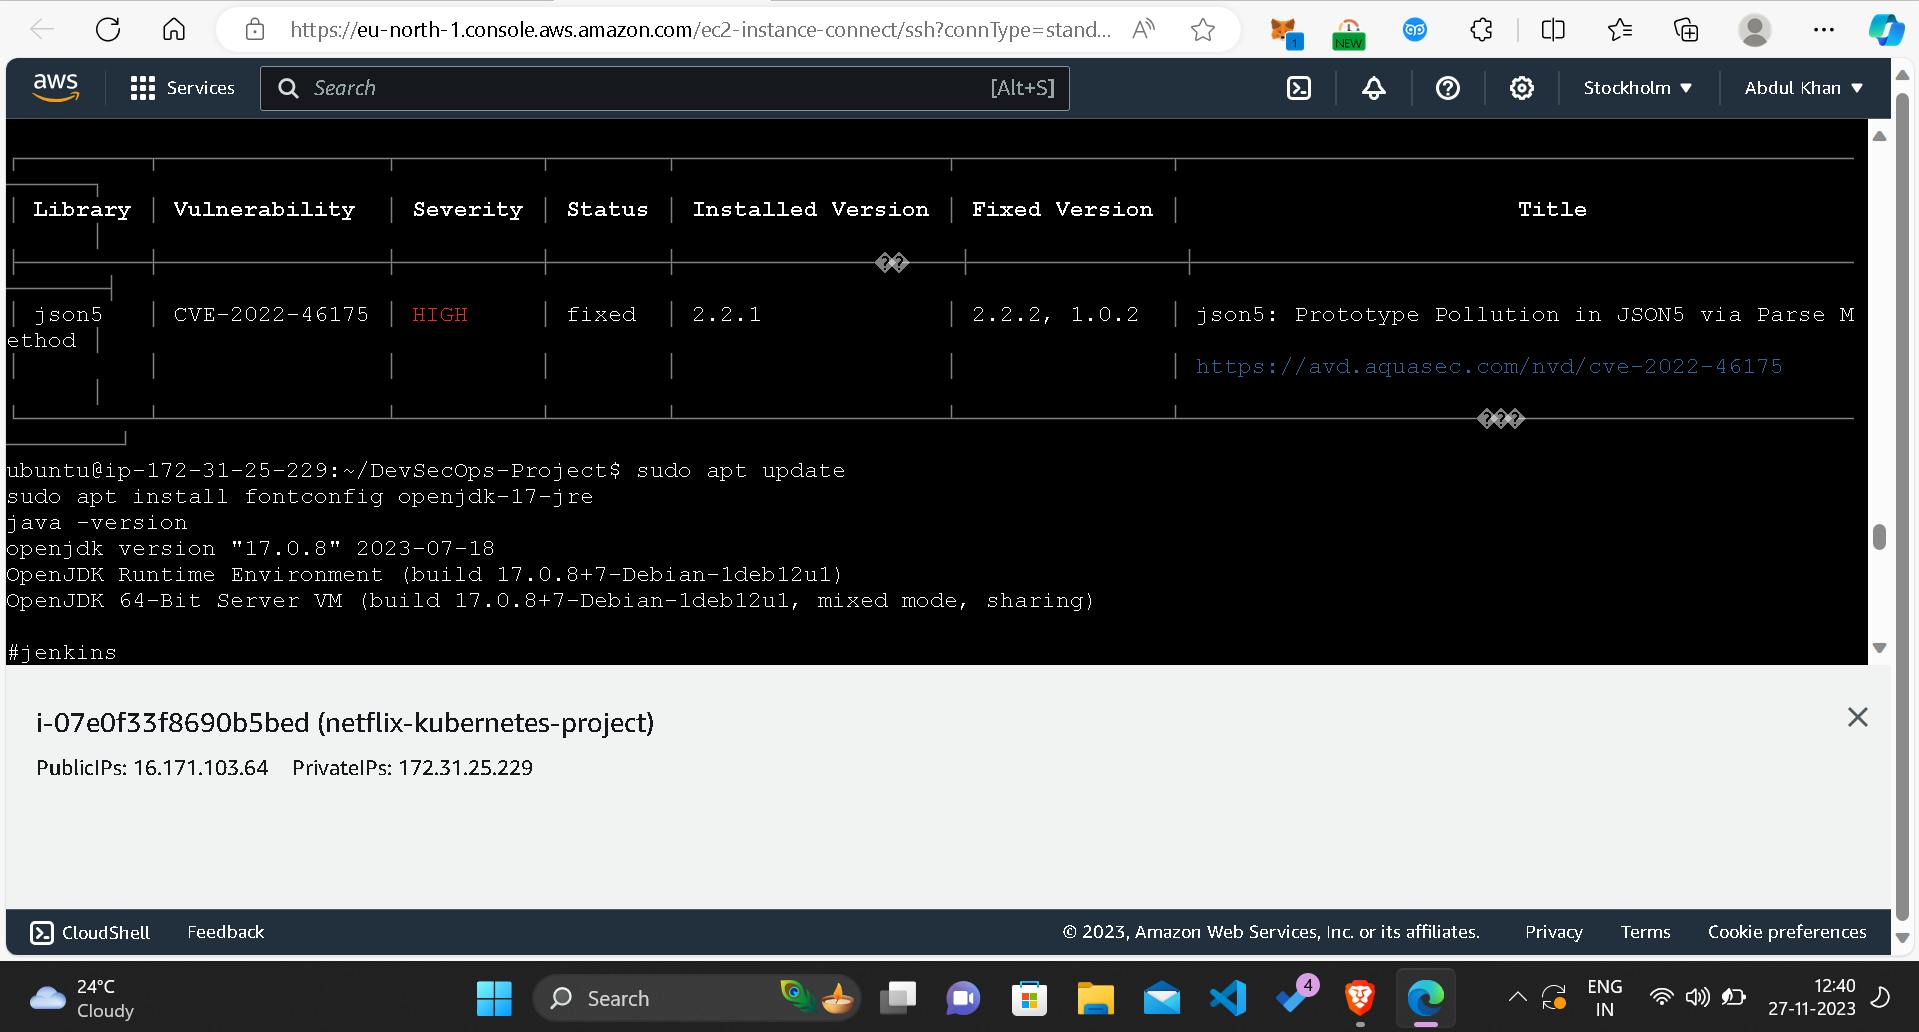
Ensuring code quality and scanning for vulnerabilities are paramount. Thus, I installed SonarQube and Trivy on the EC2 instance.
docker run -d --name sonar -p 9000:9000 sonarqube:lts-community

sudo apt-get install wget apt-transport-https gnupg lsb-release
wget -qO - https://aquasecurity.github.io/trivy-repo/deb/public.key | sudo apt-key add -
echo deb https://aquasecurity.github.io/trivy-repo/deb $(lsb_release -sc) main | sudo tee -a /etc/apt/sources.list.d/trivy.list
sudo apt-get update
sudo apt-get install trivy
Integration with the CI/CD pipeline and configuration for code analysis followed in this phase.
Phase 3: CI/CD Setup
Install Jenkins for Automation
Automating the deployment process is pivotal, so I installed Jenkins on the EC2 instance.
sudo apt update
sudo apt install fontconfig openjdk-17-jre
java -version

sudo wget -O /usr/share/keyrings/jenkins-keyring.asc \
https://pkg.jenkins.io/debian-stable/jenkins.io-2023.key
echo deb [signed-by=/usr/share/keyrings/jenkins-keyring.asc] \
https://pkg.jenkins.io/debian-stable binary/ | sudo tee \
/etc/apt/sources.list.d/jenkins.list > /dev/null
sudo apt-get update
sudo apt-get install jenkins
sudo systemctl start jenkins
sudo systemctl enable jenkins
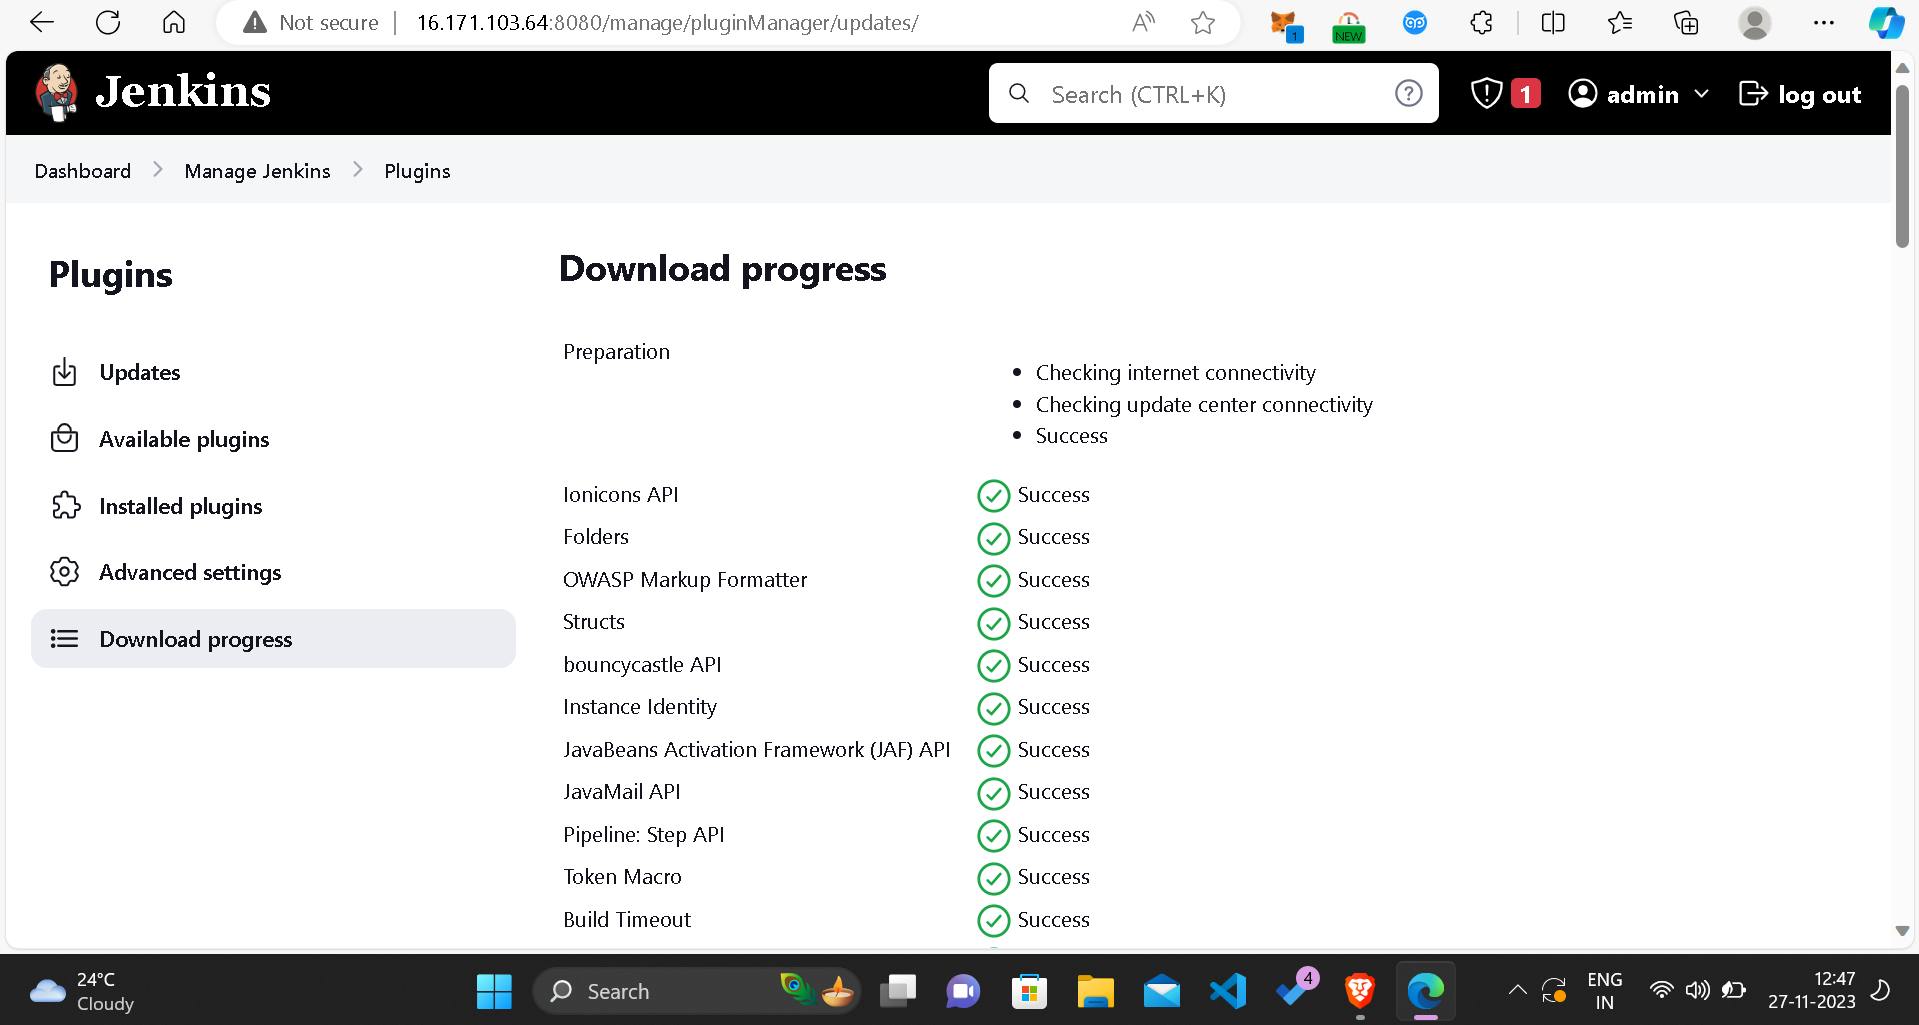
Accessing Jenkins through a web browser using the public IP of the EC2 instance and subsequent plugin installation and configuration followed suit.
If the "docker login failed" error surfaced, I adjusted Jenkins user permissions.
sudo su
sudo usermod -aG docker jenkins
sudo systemctl restart jenkins
Phase 4: Monitoring
In this phase, I focused on implementing monitoring tools to keep track of how the application is performing. Monitoring helps to identify issues early on and ensures the application runs smoothly. Here's a more detailed breakdown of the steps involved:
Install Prometheus for Metrics Collection:
Download Prometheus:
- I obtained the Prometheus software, a powerful tool for collecting and monitoring metrics from various services.
    wget https://github.com/prometheus/prometheus/releases/download/v2.47.1/prometheus-2.47.1.linux-amd64.tar.gz
    tar -xvf prometheus-2.47.1.linux-amd64.tar.gz
    cd prometheus-2.47.1.linux-amd64/
Configure Prometheus:
- I created necessary directories and moved Prometheus files to the appropriate locations.
    sudo mkdir -p /data /etc/prometheus
    sudo mv prometheus promtool /usr/local/bin/
    sudo mv consoles/ console_libraries/ /etc/prometheus/
    sudo mv prometheus.yml /etc/prometheus/prometheus.yml
    sudo chown -R prometheus:prometheus /etc/prometheus/ /data/
    sudo nano /etc/systemd/system/prometheus.service
- I pasted the Prometheus service configuration into the file.
Enable and Start Prometheus:
- Finally, I enabled and started the Prometheus service.
    sudo systemctl enable prometheus
    sudo systemctl start prometheus
Install Node Exporter for Server Metrics:
Download Node Exporter:
- I obtained Node Exporter, a Prometheus exporter that collects system metrics from servers.
    wget https://github.com/prometheus/node_exporter/releases/download/v1.6.1/node_exporter-1.6.1.linux-amd64.tar.gz
    tar -xvf node_exporter-1.6.1.linux-amd64.tar.gz
    sudo mv node_exporter-1.6.1.linux-amd64/node_exporter /usr/local/bin/
    rm -rf node_exporter*
Configure Node Exporter:
- I created a service configuration file for Node Exporter.
sudo nano /etc/systemd/system/node_exporter.service
- I pasted the Node Exporter service configuration into the file.
Enable and Start Node Exporter:
- After configuring Node Exporter, I enabled and started the service.
    sudo systemctl enable node_exporter
    sudo systemctl start node_exporter
Configure Prometheus to Scrape Metrics:
Edit Prometheus Configuration:
- I configured Prometheus to collect metrics from both Node Exporter and Jenkins by editing the Prometheus configuration file.
sudo nano /etc/prometheus/prometheus.yml
- I added scraping configurations for Node Exporter and Jenkins.
Install Grafana for Visualization:
Install Grafana:
- I installed Grafana, a platform for creating and viewing interactive dashboards.
    sudo apt-get install -y apt-transport-https software-properties-common
    wget -q -O - https://packages.grafana.com/gpg.key | sudo apt-key add -
    echo "deb https://packages.grafana.com/oss/deb stable main" | sudo tee -a /etc/apt/sources.list.d/grafana.list
    sudo apt-get update
    sudo apt-get -y install grafana
    sudo systemctl enable grafana-server
    sudo systemctl start grafana-server
Access Grafana:
- I accessed Grafana through a web browser using the server's IP address.
http://<your-server-ip>:3000
Configure Grafana:
- After logging in (default login: admin/admin), I added Prometheus as a data source and imported a dashboard for visualization.
By following these steps, I set up a strong system to watch over how well the deployed application is doing. I used Prometheus and Grafana to keep a careful check on its performance metrics.
Phase 5: Notification
Implement Notification Services
For effective communication during the CI/CD pipeline, I implemented email notifications in Jenkins and other notification mechanisms.
Phase 6: Kubernetes
This phase involves setting up and configuring Kubernetes, an open-source container orchestration platform, to manage and deploy containerized applications. Kubernetes provides scalability, automation, and ensures the efficient deployment and management of applications in a containerized environment.
Create Kubernetes Cluster with Nodegroups:
Install and Configure kubectl:
- I began by installing and configuring
kubectl, the command-line tool for interacting with Kubernetes clusters.
- I began by installing and configuring
    sudo apt-get update
    sudo apt-get install -y kubectl
- I then configured
kubectlto connect to my AWS Kubernetes cluster.
Set Up Amazon EKS (Elastic Kubernetes Service):
- Using the AWS Management Console, I created an Amazon EKS cluster. This involved defining the cluster name, networking settings, and specifying the desired Kubernetes version.
Create Nodegroups:
I set up nodegroups within the EKS cluster. Nodegroups are groups of worker nodes that run containerized applications.
Nodegroups can be configured for specific purposes, such as handling different types of workloads or ensuring high availability.
Monitor Kubernetes with Prometheus:
Install Helm:
- Helm is a package manager for Kubernetes that simplifies the deployment and management of applications.
    wget https://get.helm.sh/helm-v3.7.0-linux-amd64.tar.gz
    tar -zxvf helm-v3.7.0-linux-amd64.tar.gz
    sudo mv linux-amd64/helm /usr/local/bin/helm
Install Node Exporter Using Helm:
- I utilized Helm to install Node Exporter on each node of the Kubernetes cluster. Node Exporter collects system-level metrics.
    helm repo add prometheus-community https://prometheus-community.github.io/helm-charts
    helm repo update
    helm install node-exporter prometheus-community/prometheus-node-exporter
Deploy Application with ArgoCD:
Install ArgoCD:
- ArgoCD is a declarative, GitOps continuous delivery tool for Kubernetes. I installed ArgoCD on the Kubernetes cluster.
    kubectl create namespace argocd
    kubectl apply -n argocd -f https://raw.githubusercontent.com/argoproj/argo-cd/stable/manifests/install.yaml
Access ArgoCD Dashboard:
- I accessed the ArgoCD dashboard to manage and deploy applications in a GitOps manner.
kubectl port-forward svc/argocd-server -n argocd 8080:443
- I then accessed the dashboard at
https://localhost:8080using a web browser.
Configure Application in ArgoCD:
I configured ArgoCD to deploy the Netflix Clone application. This involved linking the ArgoCD application to the GitHub repository where the application code is stored.
ArgoCD automatically detects changes in the Git repository and deploys the application accordingly.
Scale the Kubernetes Cluster:
Adjust Nodegroup Configurations:
Depending on the workload and requirements, I adjusted the configurations of the nodegroups within the EKS cluster.
This could involve changing the number of nodes, instance types, or other parameters to meet performance and resource demands.
Monitor and Scale:
I utilized Kubernetes tools and dashboards to monitor the performance of the cluster.
When needed, I scaled the cluster by adding or removing nodes, ensuring optimal resource utilization.
Verify Deployment and Rollback if Necessary:
Application Verification:
- After deploying the application using ArgoCD, I verified its successful deployment by checking the Kubernetes pods, services, and logs.
Rollback Procedures:
In case of issues or errors, I had rollback procedures in place. ArgoCD allows for easy rollback to a previous known-good state.
I used ArgoCD to initiate a rollback, ensuring that the application reverted to a stable version.
Phase 7: Cleanup
Cleanup AWS EC2 Instances
To avoid unnecessary costs, I terminated AWS EC2 instances that were no longer needed.
aws ec2 terminate-instances --instance-ids <instance-id>
Conclusion
This project shows a complete way of doing things in the different stages of getting an application ready to use. I took care of important things like getting it set up, making it safe, automating tasks, keeping an eye on it, sending notifications, and making sure it can grow as needed. By using AWS and Kubernetes, not only did I make the Netflix Clone application ready to use, but I also made it strong against potential problems, automated how it gets updated, watched how well it worked, and managed it well in a special kind of environment.